- 1
Analyse a flight in the 3D replay
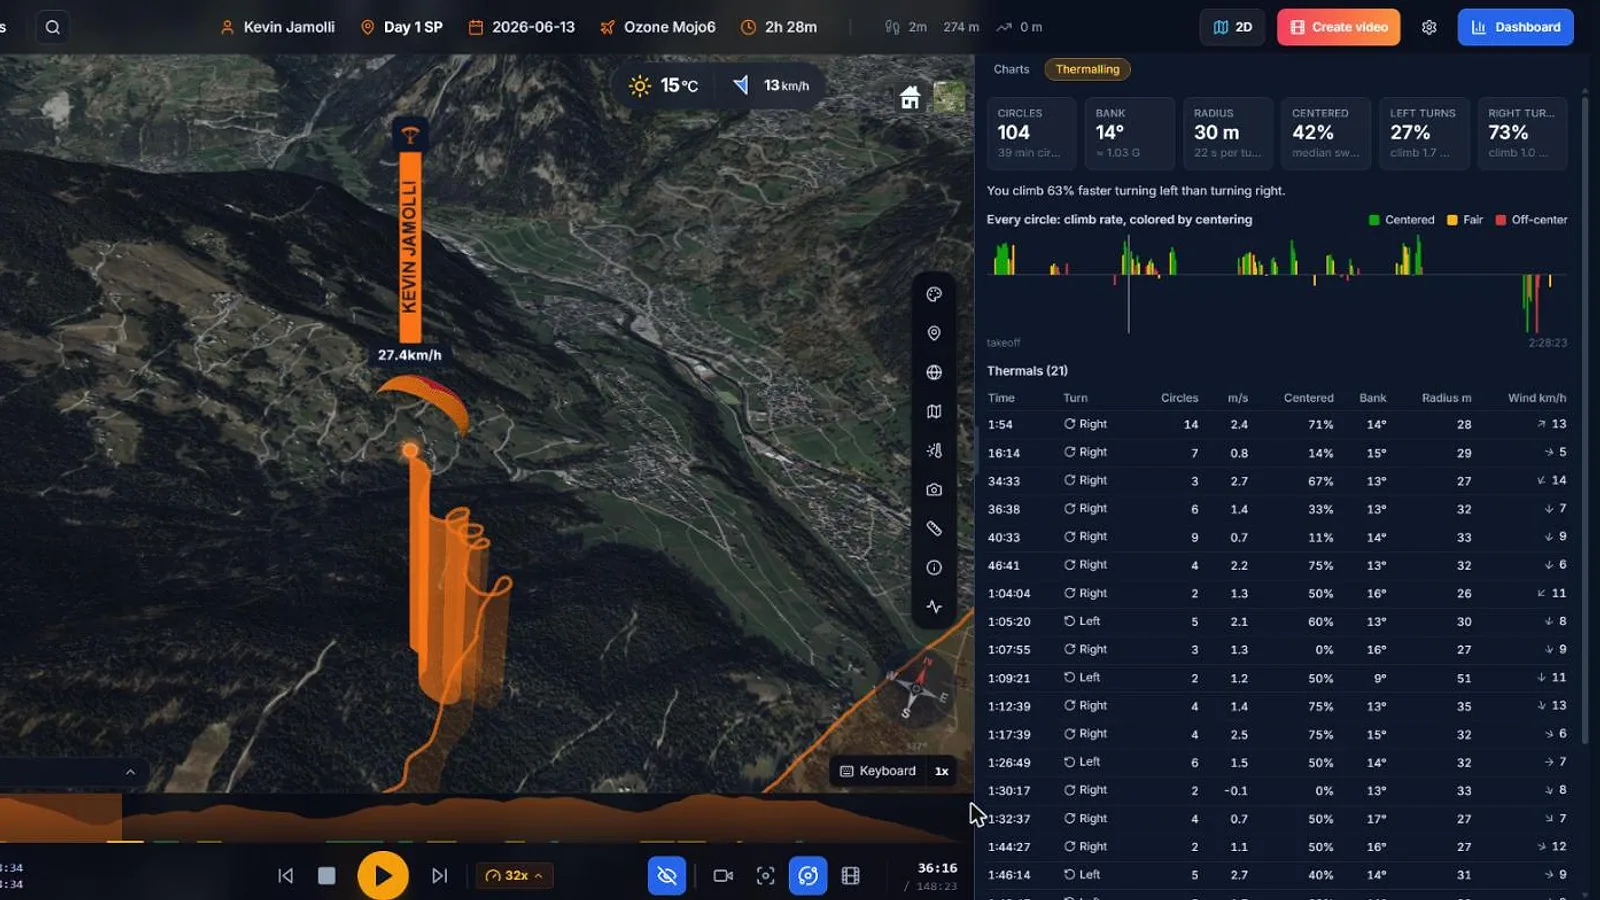
Open a flight in 3D. The thermalling panel shows every circle with its climb rate, coloured by centering, and the list of your thermals.
Click a thermal to jump the replay there and watch how you worked it.
- 2
Read the flight analysis on the map
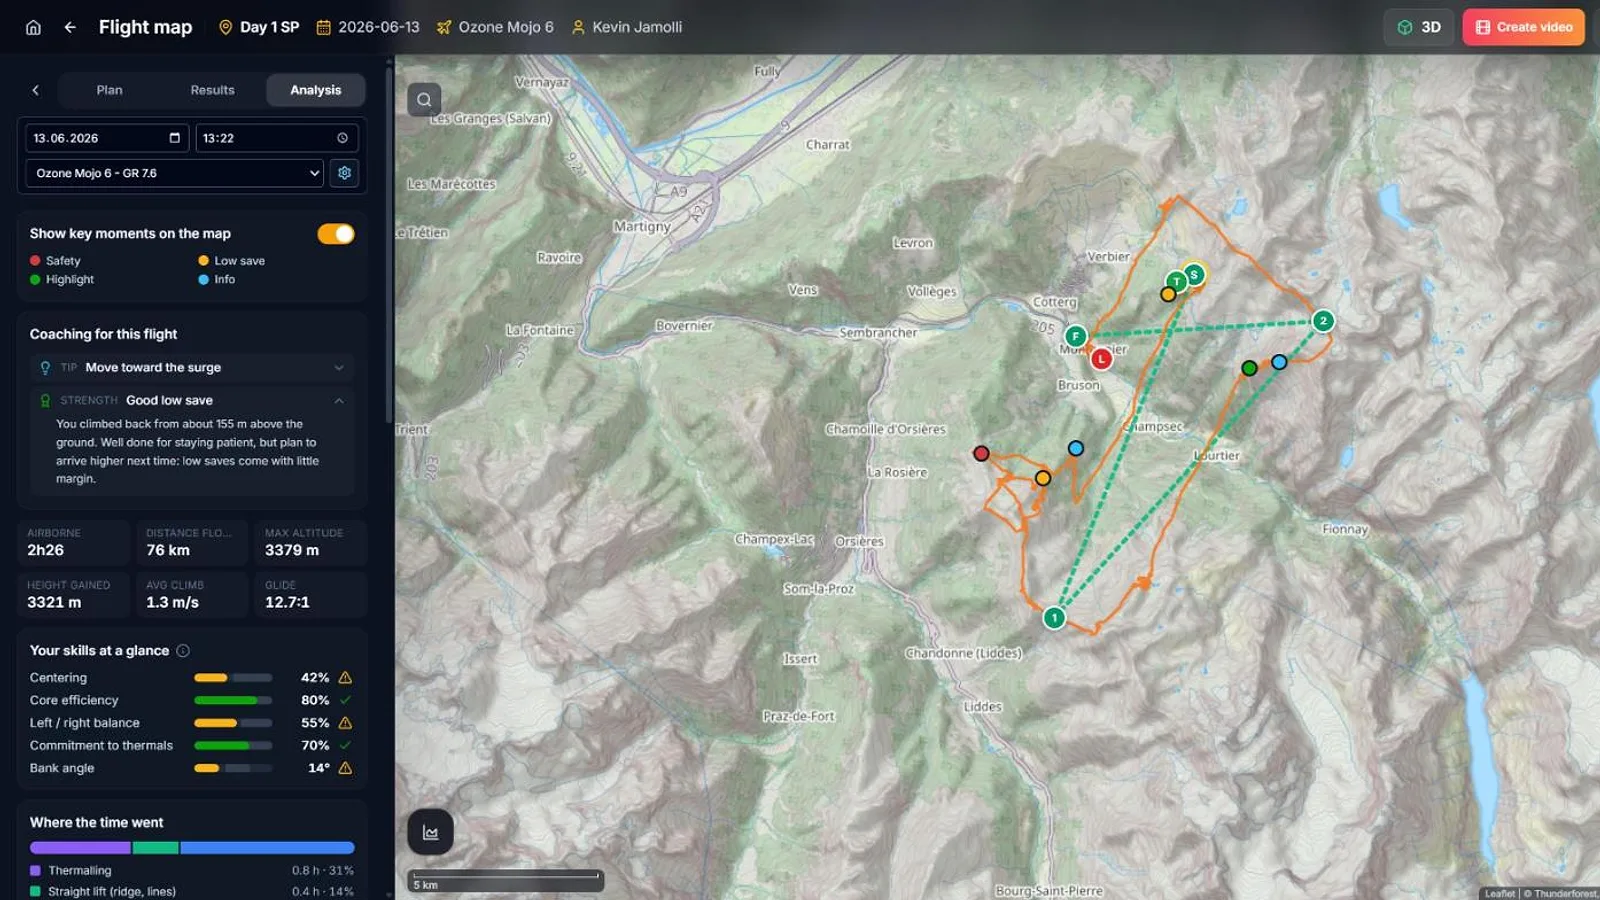
Open the same flight in the Route Planner and choose the Analysis tab: time budget, thermals, glides, low saves, safety margins, wind and lee side.
Each row takes the map to that moment, and each marker opens its row.
- 3
Open your coach
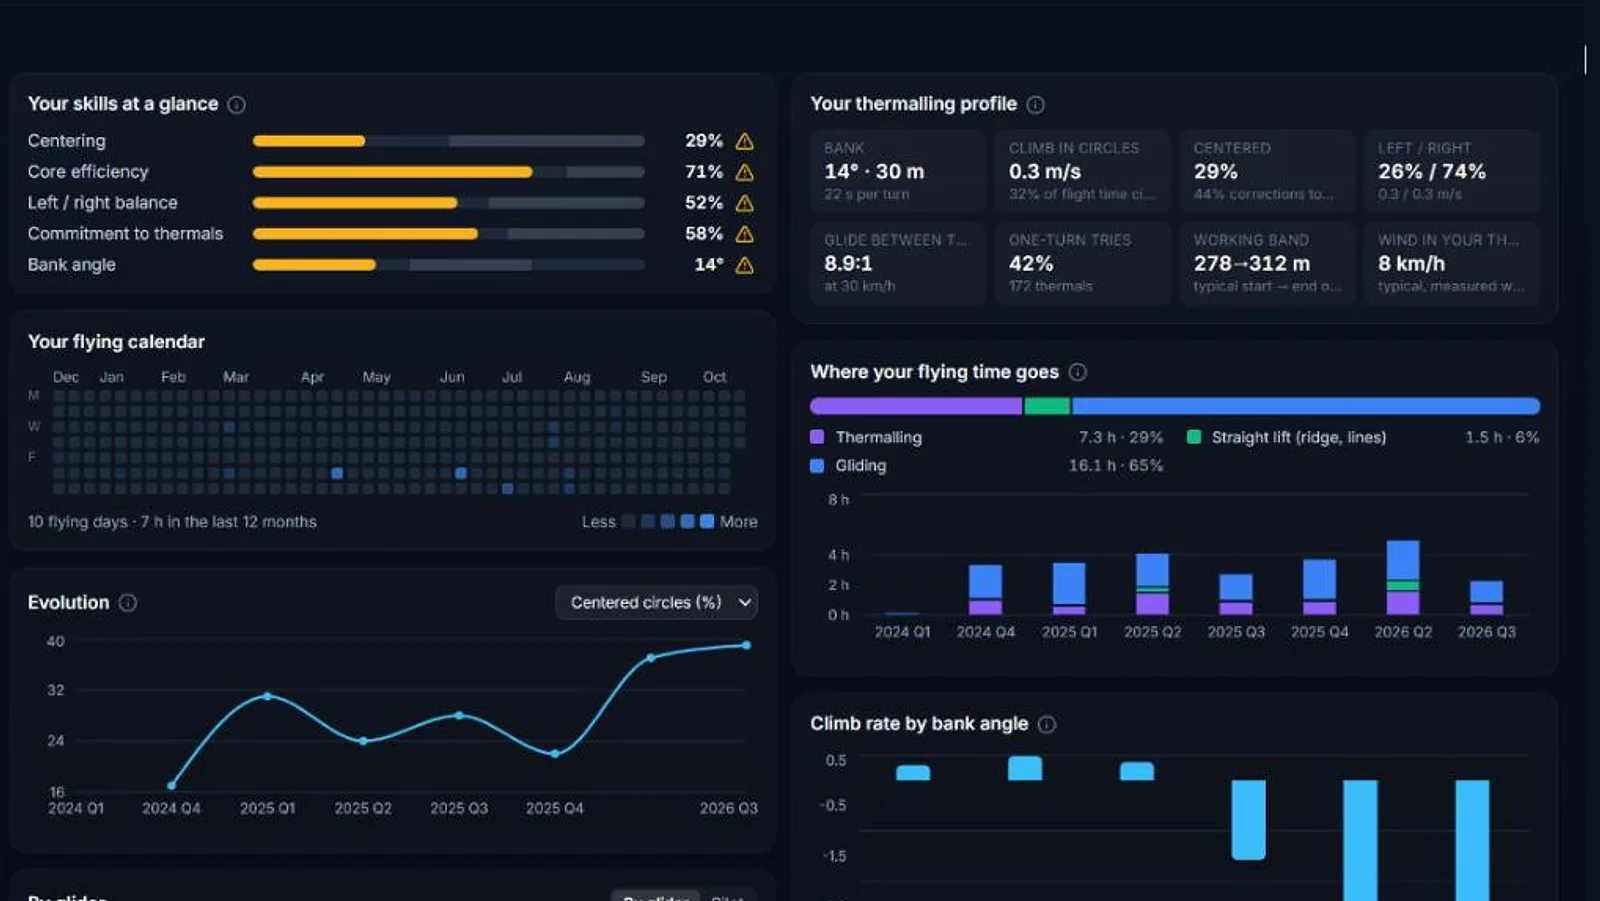
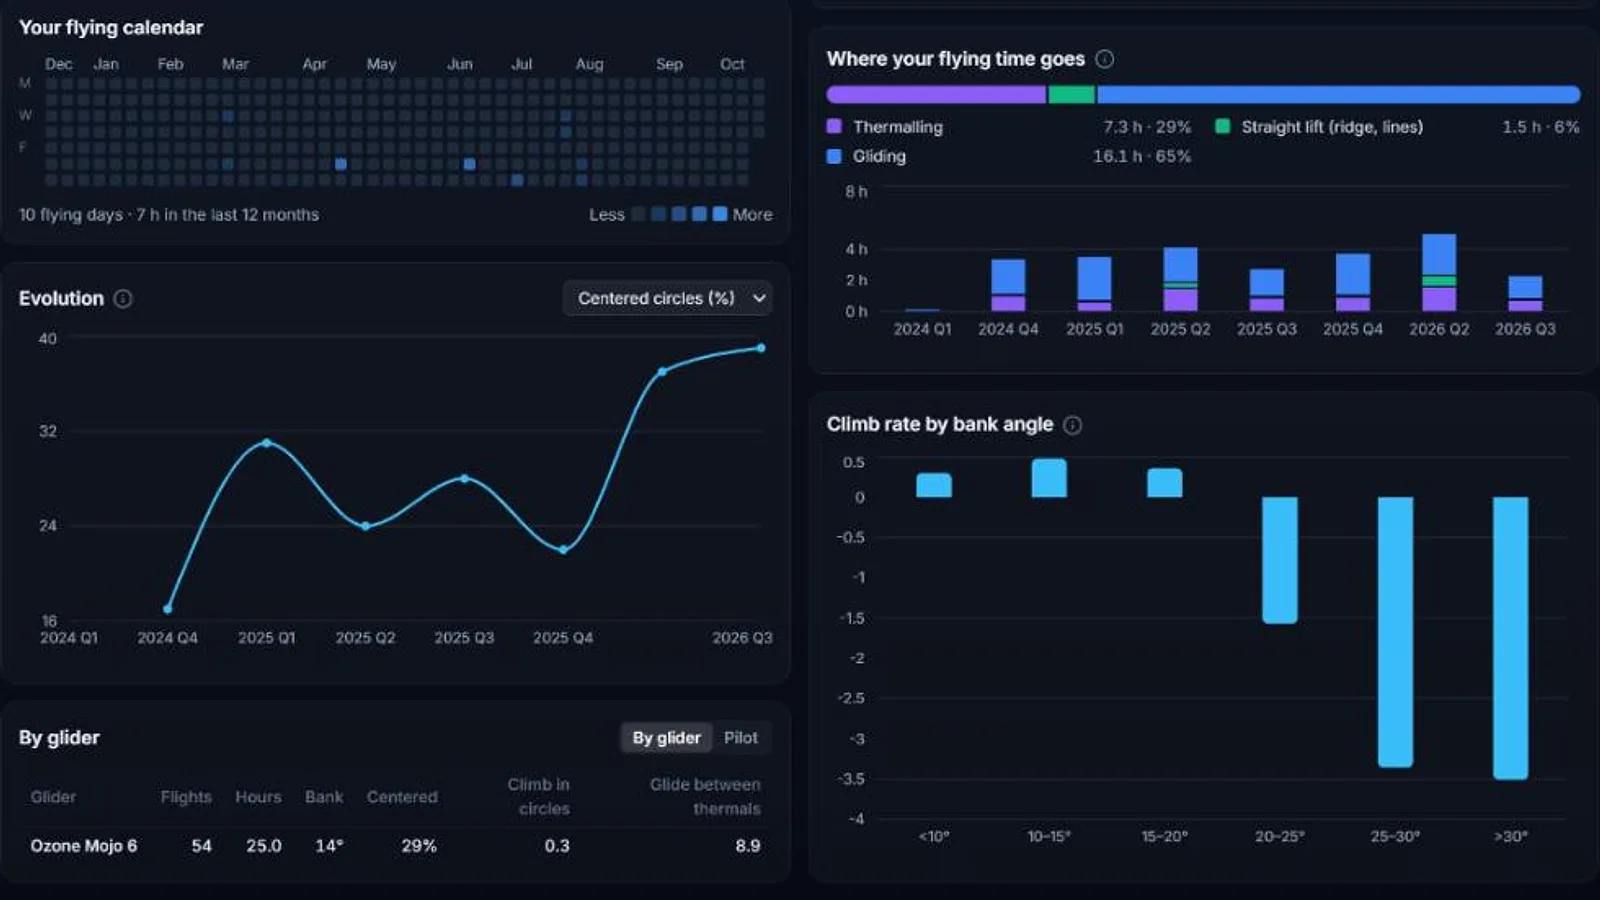
Open Coach from the menu. XCviewer analyses all your flights and builds your profile: centering, bank, radius, turn direction and climb by bank angle.
Filter by period or by glider to compare seasons and wings.
- 4
Follow the advice
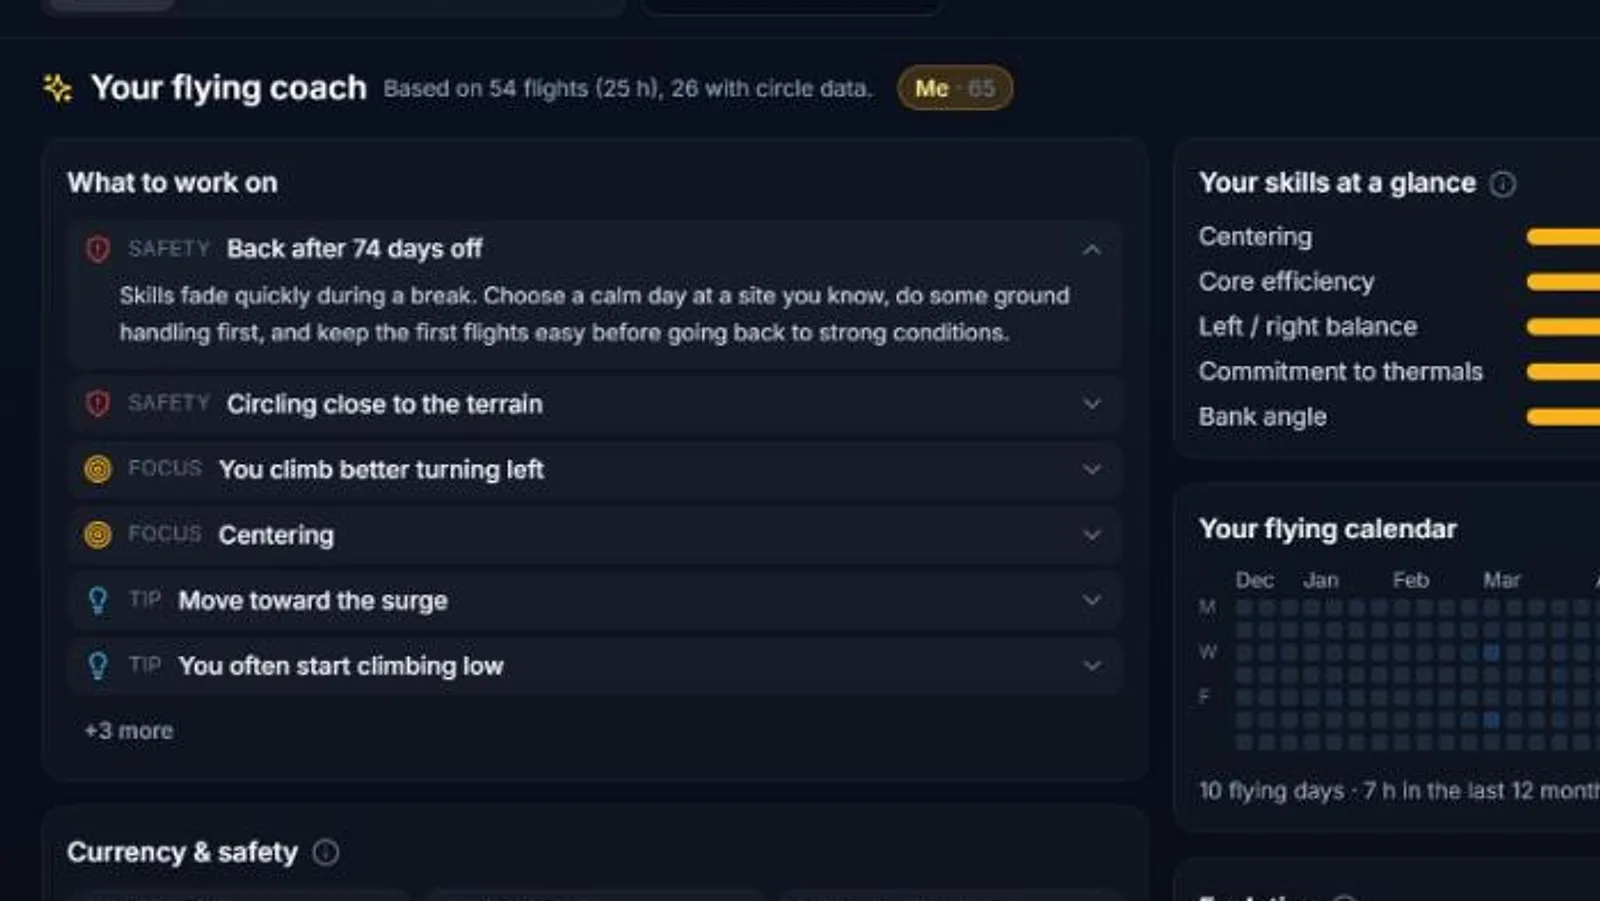
Advice is ranked by priority: low circles, lee exposure, strong spirals, weak thermals, a long break before your next flight.
Each piece of advice shows the evidence from your tracks and what to practise next.
Bring your coach page to your next session with your instructor.
- 5
Track your progress
Evolution charts show how your centering and climb rate change over time, the calendar shows your flying days, and the budget shows where your flying time goes.
Instructors can compare pilots in a shared logbook and open each pilot's coaching.
Frequently asked questions
Where does the coaching data come from?
Only from your GPS tracks: the shape, drift and climb of each circle, and the terrain under you. No extra sensor is needed.
Is the coach free?
The first coach modules and the top of each flight analysis are free. The full coaching and the complete analysis are part of Pro.
Does it replace an instructor?
No. It points to habits worth working on. Practise with an instructor, and take an SIV course for anything related to collapses or spirals.