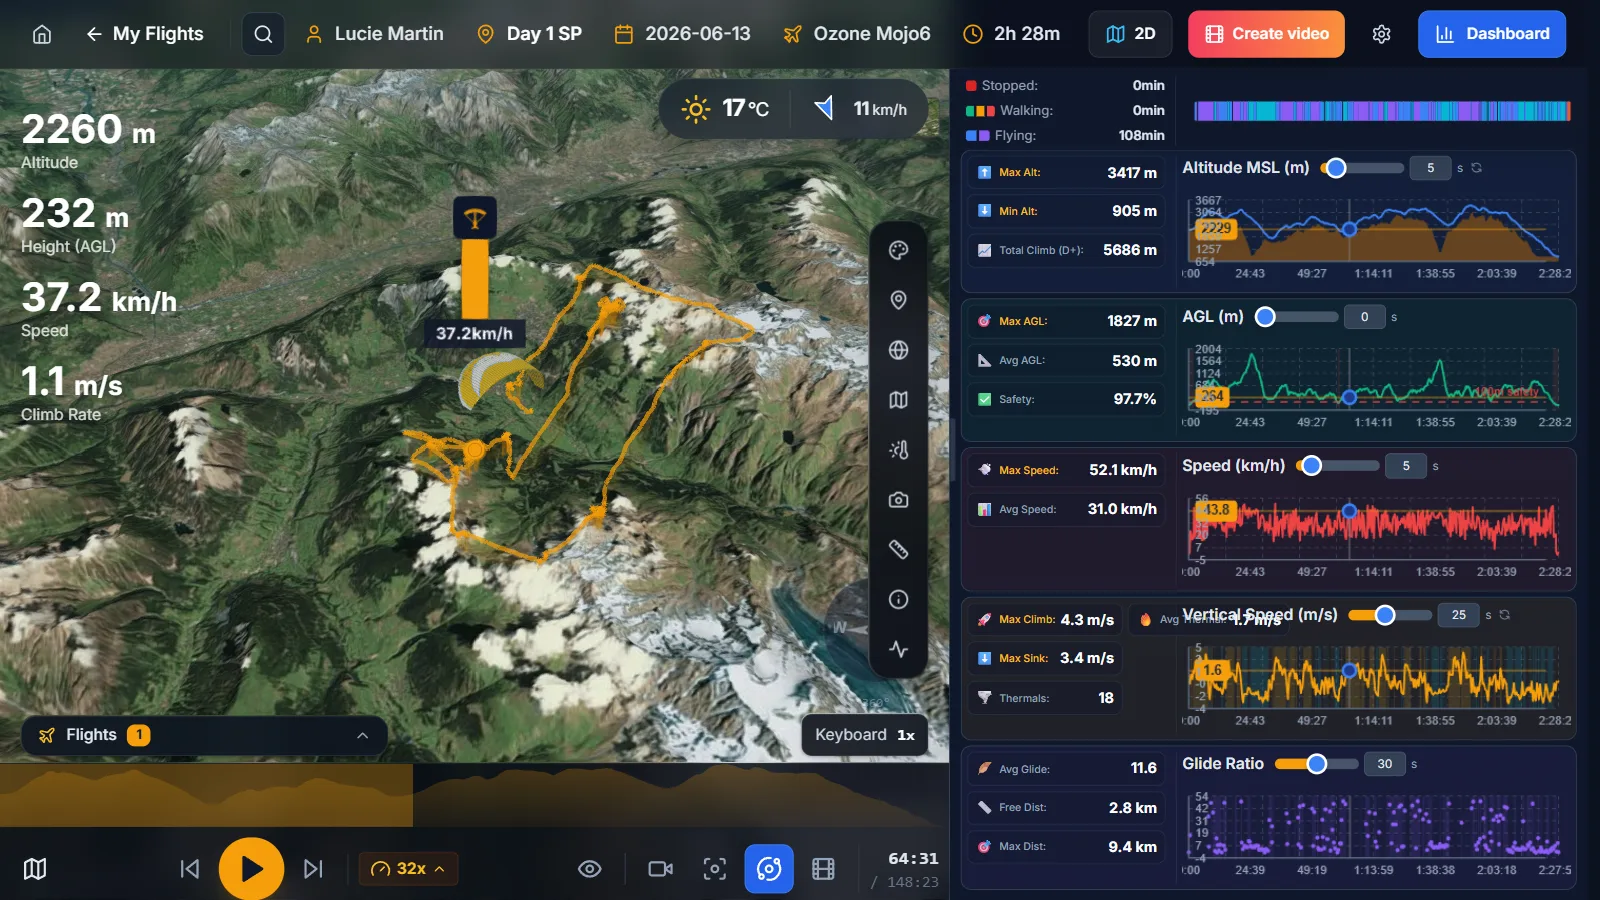
XCviewer turns your IGC file into a complete paragliding flight analysis. Altitude, speed, climb-rate and glide-ratio charts are linked to the 3D view, so hovering a chart moves your glider to that exact moment. Climb and glide statistics and XContest-style scoring show where you gained or lost time, and track colors reveal your best thermal cores and the sink you flew through.
What you get
- Linked altitude, speed, vario and glide-ratio charts.
- Climb and glide statistics computed from your track.
- XContest-style scoring for free distance, flat triangles and FAI triangles.
- Track colors by climb rate, altitude, speed or height above ground (Pro).
- Measuring tool for distances, bearings and glides between any two points (Pro).
Why pilots use it
- Spot where you lost height and which thermals were worth taking.
- Follow your progression from flight to flight with objective numbers.
- Debrief with your instructor or friends using the same data.
Related features

Flight Comparison in Sync
Replay multiple pilots side-by-side to compare tactics, match thermals, and learn from every glide.
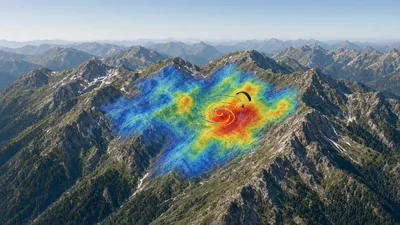
Thermal Overlay by KK7
Layer KK7 thermal hotspots over your route to understand convection strength and plan efficient climbs.
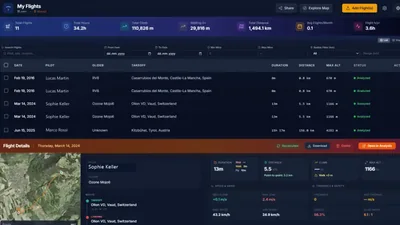
Smart Flight Collection
Organize your flights in a personal collection, relive your adventures, and share interactive replays seamlessly with friends.