- 1
Open the dashboard
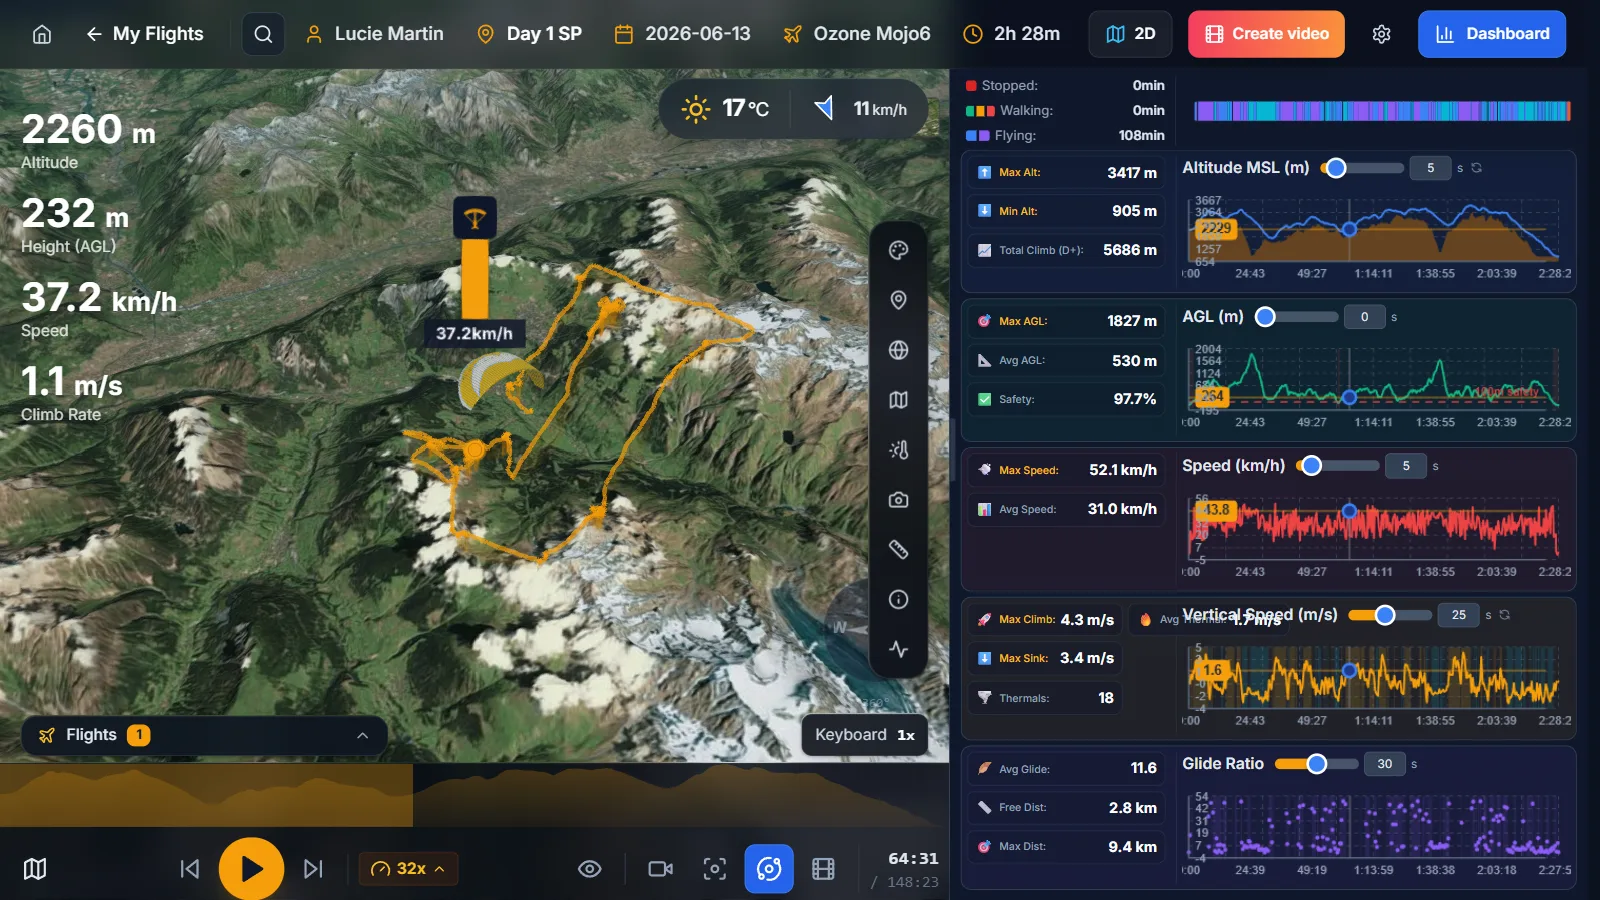
Click Dashboard in the top bar to open the detailed charts: altitude, speed, climb rate and glide ratio over time.
The charts are linked to the 3D view, so hovering a chart moves the glider to that exact moment.
- 2
Color the track by climb rate
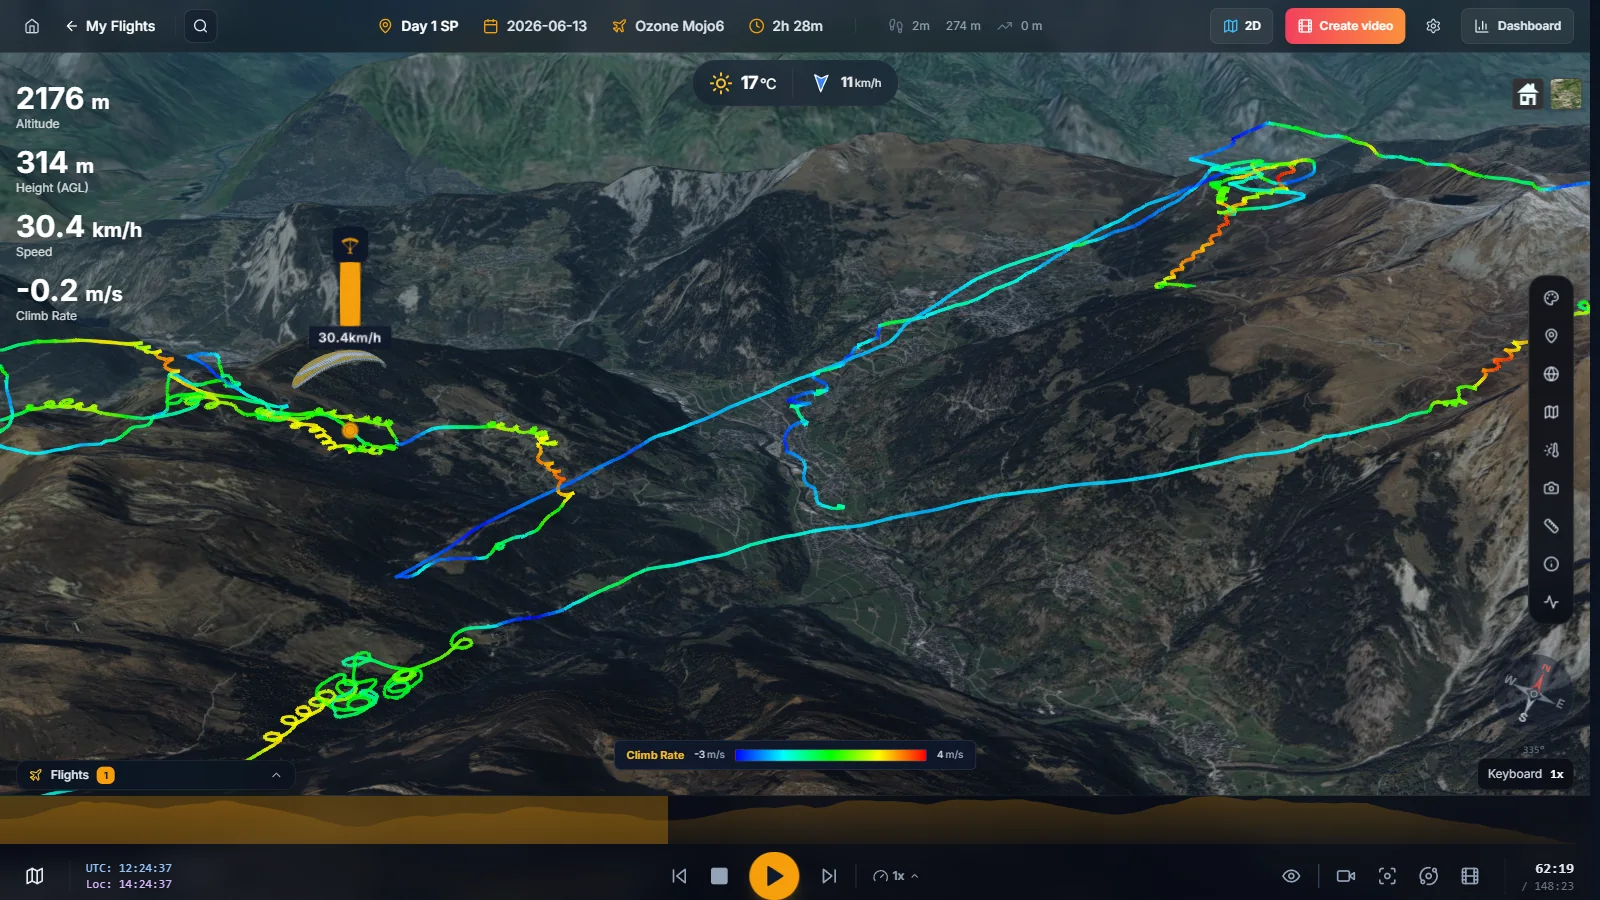
Open Track Colors in the right toolbar and choose a metric such as climb rate, altitude or speed.
With climb rate, warm colors show strong climbs and blue shows sink, so you can spot your best thermals and the cores you missed at a glance.
- 3
Compare with the thermal map
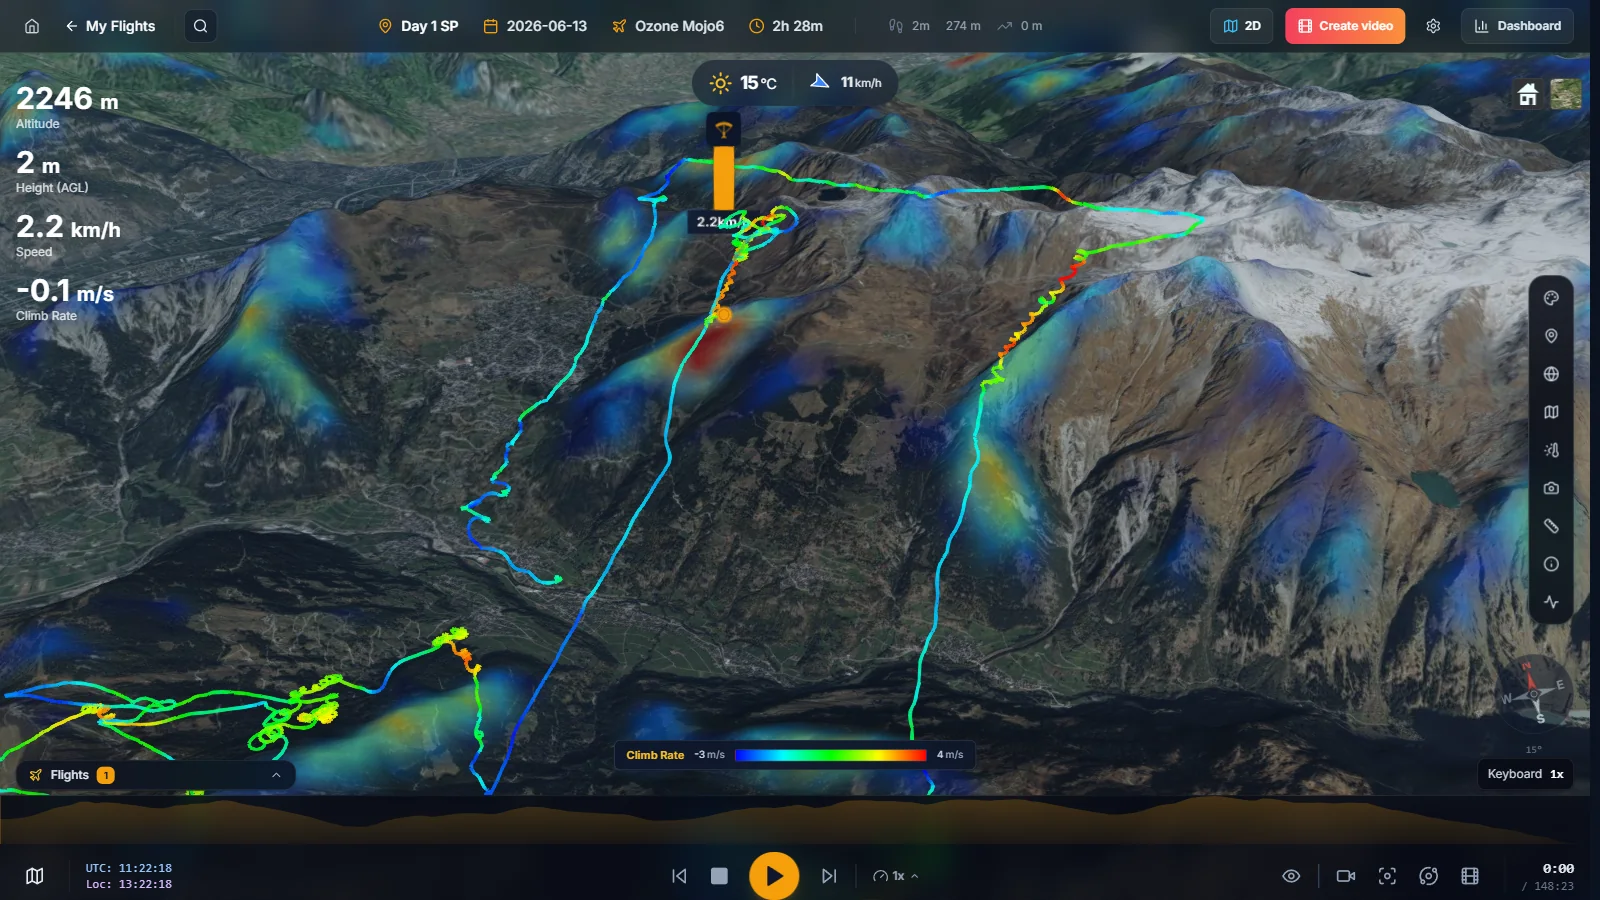
Open Thermals in the right toolbar and turn on the thermal map. It overlays the kk7 thermal probability map on the terrain.
Check whether your climbs matched the known thermal hotspots and where you could have found lift earlier.
- 4
Measure distances and glides
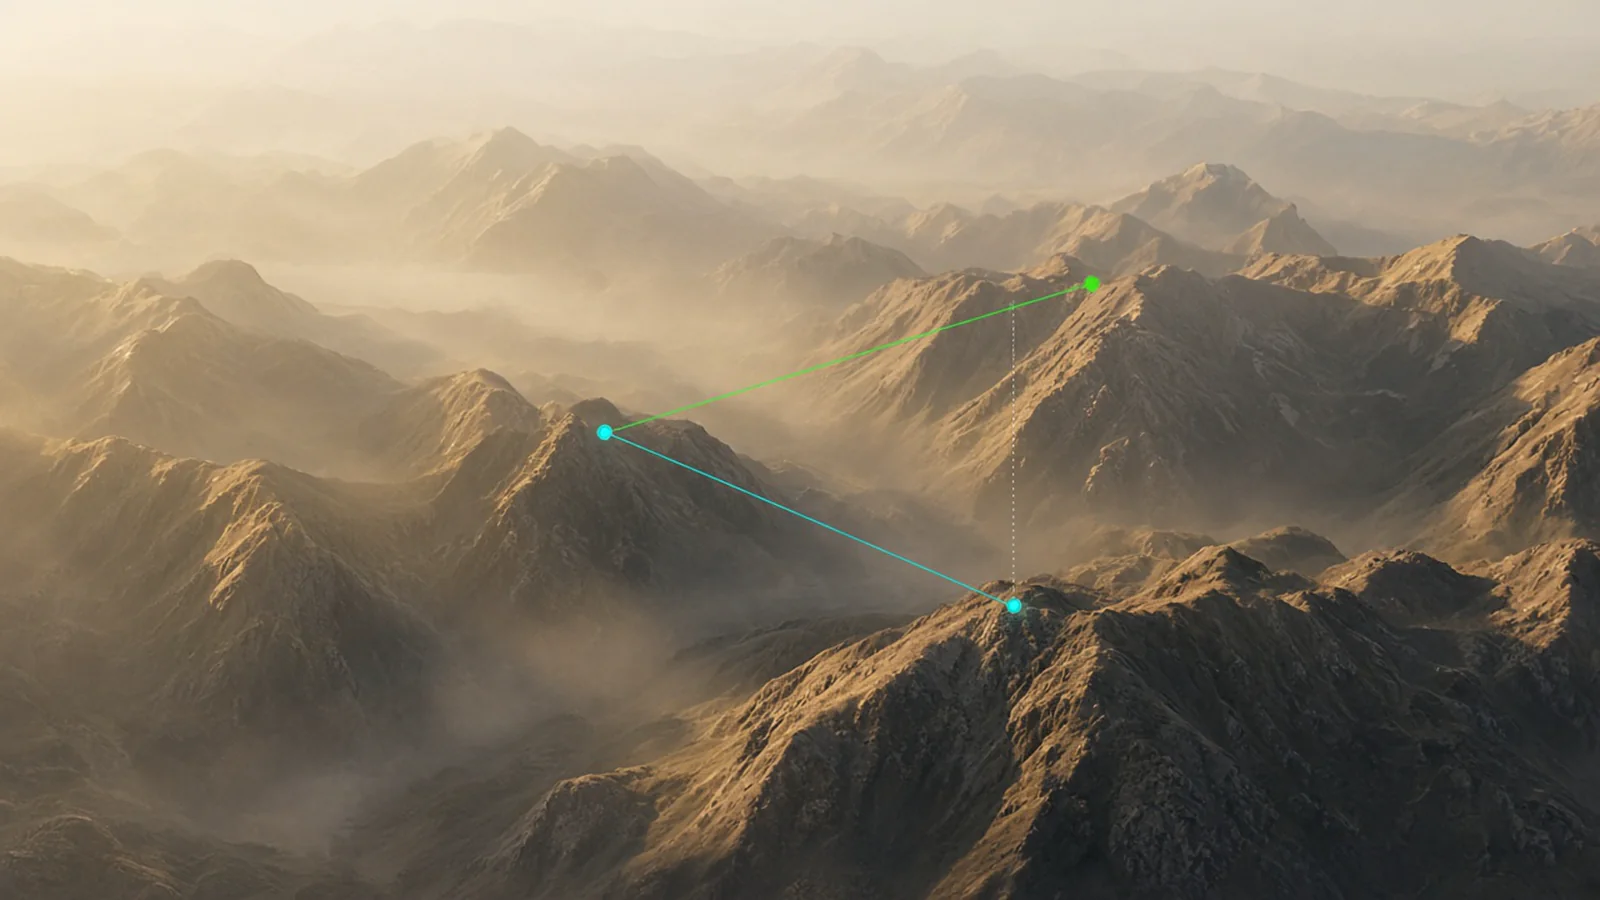
Open the Measurement Tool and click points on the map to measure distances, height differences and the glide ratio between them.
It is ideal for checking a final glide, the distance to a turnpoint or the size of a valley crossing.
Combine the measuring tool with the sun position in World settings to see when slopes were in the sun.