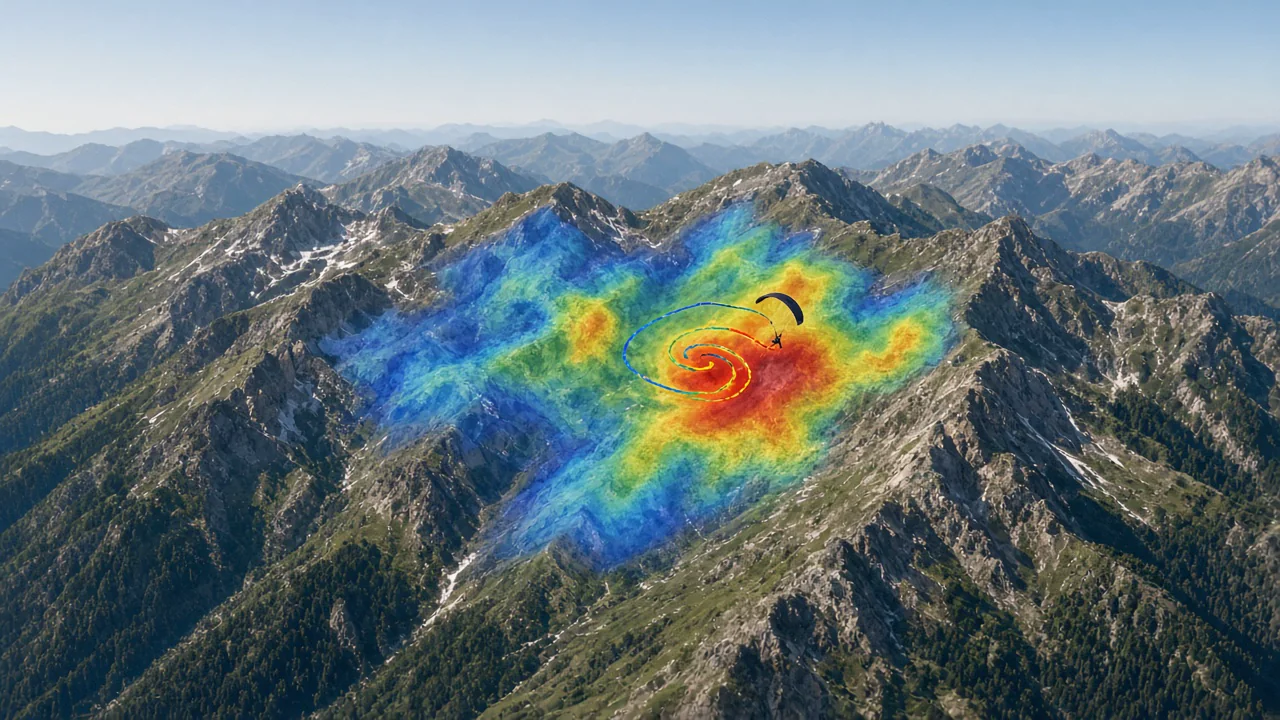
Overlay KK7 thermals and thermal map data directly onto your 3D flight view. This integration brings crowd-sourced thermal hotspot intelligence into your planning and analysis workflow, helping you understand where thermals typically develop and how to connect them efficiently.
What you get
- KK7 thermals overlay with hotspot intensity and average climb rate data.
- Thermal map layer showing historical convection patterns over your flying area.
- Adjustable transparency and zoom to blend thermal data with terrain and tracks.
- Seasonal and time-of-day filtering to match the thermal map to your conditions.
- Integration with route planning to design lines that connect the strongest thermals.
Why it matters for you
- Lets you plan routes using proven KK7 thermals rather than guesswork.
- Reveals thermal map patterns that take years to learn by experience alone.
- Improves XC distance by helping you anticipate and connect thermal sources.
Related features

Flight Comparison in Sync
Replay multiple pilots side-by-side to compare tactics, match thermals, and learn from every glide.
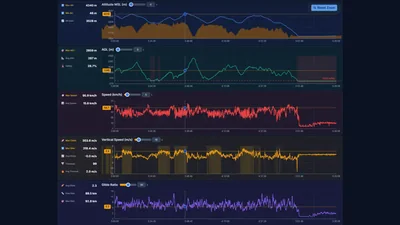
Detailed Graph Analysis
Link altitude, vario, wind, and energy graphs with precise timeline scrubbing for data-driven insights.
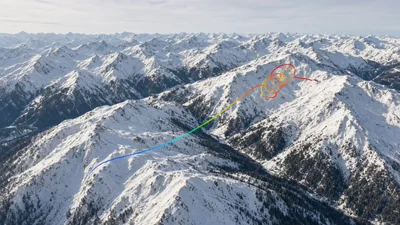
Path Colorization
Color-code your track by altitude, climb rate, speed, or glide to surface the story behind every line.